Study of Digital Uniqueness in Human Interaction With Smart Phones and Tablets
November 2013
Secure and Simplify your Digital LifeTM
Overview
TraitWare® is based on the premise of our God-given uniqueness, which allows us to influence and define the world around us, and which we translate into our digital surroundings. Human beings have a highly developed skill that allows us to recognize certain attributes, such as appearance and behavior, to distinguish one individual from another. Further, we store the characteristics of those individuals in our memory in order to recognize them again from those stored attributes. As we first get to know someone we primarily use sight to recognize physical characteristics, as well as hearing, touch, and smell. As we get to know an individual further, we can connect names, voice traits, and memories to those individuals.
Typically, characteristics change gradually with time and age. But they can change significantly over shorter periods of time when a person gets new glasses, changes hairstyle or coloring, or has other physical and mental changes related to an accident or illness. In most cases, this has little or no impact on their ability to be recognized and identified.
Artists, writers, and musicians can often be identified by the character of the works they created because of the unique features of their interaction with the medium in which they work. In the same way, as we use our mobile devices and computers we imbue them with unique traits that create a highly differentiated digital representation of our unique identity.
TraitWare® detects certain user-generated patterns from content created by the user on his or her device. These ‘traits’ are a digital representation of a person’s unique digital identity. They are a type of fingerprint that is completely unique to them, one that evolves through time, with experience, and the user’s interaction with the digital world itself. Harnessing this uniqueness can allow for simpler and more secure identity authentication for device owners.
Through continuous use of their personal computer, tablet, or mobile smartphone, a user interacts with and shapes the content on that device. A smart device, like an iPhone, iPad, or Android device provides a simple way to gather information about a person. There are many examples of applications that analyze the activity and data generated from a smart device, but those applications are typically seeking to exploit that information for commercial uses, such as marketing products and services to the end user. TraitWare® is different in that it seeks to heighten the security of the device, as well as enhance the user experience through a process that highly differentiates its user from friend and foe alike.
TraitWare® currently uses an application installed on a smartphone to gather what we call a ‘trait signature’ that can be used to uniquely identify an individual to a virtual certainty. A trait signature is a representation of one or more digital elements stored on a device that are unique to the individual and distinct from the hardware of the device itself. This could include elements such as the user’s contact list, song list, or installed apps. The TraitWare® application is designed to protect the user’s confidential information and to ensure the trait signature emanating from that device is from a device registered to a previously authenticated individual. There are several sets of information available from most smartphones that can be used to create a trait signature. These sets can then be used to measure the difference from one person’s traits to another’s. Through statistical analysis of a real data set, the differences measured turned out to be quite large with respect to the human population, almost guaranteeing uniqueness based on only a single trait. The data obtained to date also shows that it does not seem to matter if people were related or had frequent interactions. People who were related did not necessarily have the most in common, and in one instance had the least in common. The initial data set intentionally included husbands and wives, parents and children, and co-workers.
TraitWare® Research
To allow for analysis, data for selected trait signatures were collected from several individuals’ smartphones. Three sets of distinct attributes were collected: contact names, contact phone numbers, and song lists. After the collection of trait signatures were obtained, they were analyzed to determine the differences between each of the trait signature characteristics between individuals. To determine the difference in the trait signatures of contact names from one individual to another we used the Levenshtein distance. The Levenshtein distance is a mathematical formula that measures the distance between two sequences. Here that represents the percent difference from one trait signature characteristic to another, where we compare the names in one individual’s contact list to another’s. The Levenshtein difference in the contact list was computed between a set of individual devices, creating 45 comparisons. Then a distribution of the count of devices with a trait signature difference that falls within a 5% interval was determined. For example, we found that 8 comparisons fell within the interval from 85-90%. This means eight (8) comparisons showed a trait signature characteristic difference of 85-90%, which implies a similarity of 10-15%. Distribution plots are shown in Figures 1 and 2. Plotting the total number of devices with a trait signature characteristic having a difference from the same trait signature characteristic from multiple devices (for a particular interval, here 5%) forms nearly a standard lognormal bell-shaped curve.
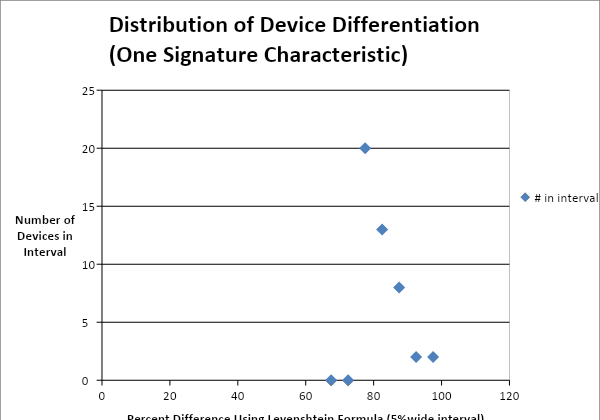
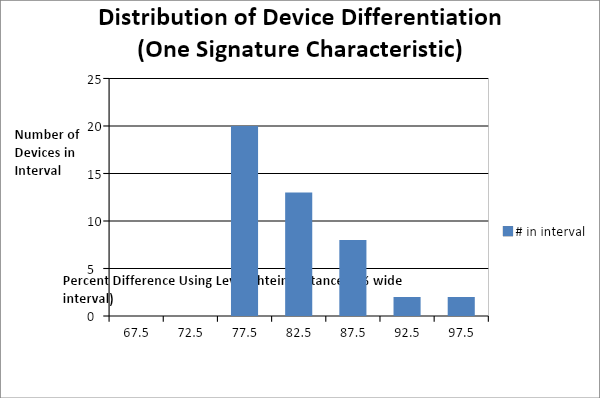
Knowing the form of the distribution, statistical methods can be used to calculate the probability that a trait signature came from a particular individual. This is based on the difference in the trait signature characteristic from one previously stored for that or any other device. Though we only present data for contact names here, attributes tested for song names and phones numbers produce distributions similar to that of the contact names.
The average distance and standard deviation of the distributions were calculated. When you compare a particular trait signature for an individual against himself or herself we find no difference if they have made no changes to their device that affected the attribute used to form the trait signature. But just like the physical attributes mentioned above change with time, so can the trait signatures, since they are based on the user’s use of the device.
For the limited study we conducted, it was found that the average distance between an individual’s contact name characteristics was 81.9% with a deviation of 5.47%. For this particular trait signature of contact names, it was found that a 43.64% difference in the trait signature corresponds to a 7-sigma deviation or a uniqueness of 1 in 390 billion. Thus the likelihood of a trait signature still belonging to the same individual when the difference between the compared trait signatures is less than 43.64% is 99.9999999997% or greater. This means that a person could change their contact list by 43% and still be identified to an extremely high degree of certainty. For this limited data set, all users were found to have contact lists, but all users did not have song lists. This study addresses only the case where traits are available for comparison.
False Positives and False Negatives
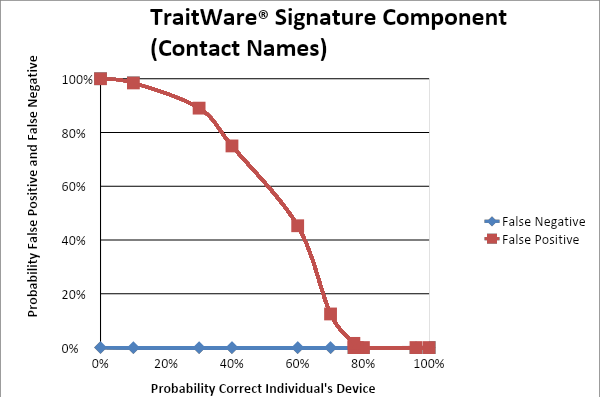
The false positives and false negatives were determined for one trait signature characteristic using contact names. The statistical analysis was based on the probability of identifying the individual based on the difference between a first trait signature representing the individual and a second trait signature, which may represent anyone in the data set. (A False Positive produces a positive result for a trait signature that is not the actual individual. A False Negative produces a negative result for a trait signature that is the actual individual.)
For this limited test of the trait characteristic, there were no false negatives within the data set. Some users were tested over time but changes in the characteristics were too small to cause a false negative. False positives were only present when the unique determination of the individual was less than 77.17%, which corresponded to a difference in the trait signature of 67.8%. Any smaller difference would produce a higher probability in the determination of the uniqueness of the individual. Figure 3 below shows a plot of the probabilities of false negatives and false positives. For false positives one can see the curve start to form around 77% along the horizontal axis, representing an increase in false positives as the probability that the correct individual’s characteristic can be identified decreases. False negatives remain at 0% throughout, representing the lack of data to demonstrate a false negative.
The above statistical analysis is for one characteristic. When multiple characteristics are used, the probabilities of each element of the trait signature matching to one individual are multiplied. This creates a combined probability and the complete trait signature represents the individual originally registered with personally identifiable information during the initial proofing process. The trait signature probability is then multiplied by the probability that represents the accuracy of the personally identifiable information to get a TraitWareID® confidence score. In real-world scenarios, the process of salting and hashing the trait signature is employed to ensure the proper use of sensitive data that is resident on the device and to mitigate the possibility that anything transmitted from the device could be transformed back into its original state.
Additional Comments
Although we have addressed the dynamic nature of a single trait signature characteristic over time in our analysis in a limited way, we anticipate false negatives will arise when a user changes a single trait signature characteristic by more than 44%. Contact lists generally consisted of over 100 contacts, making the likelihood of drastic changes less likely, but not impossible. Further research needs to be done to address the issue of large changes to a single trait signature characteristic. If multiple signature characteristics are used it is possible to override a single signature characteristic with a large change. As an example, take the case of two generic signature characteristics where one has a large change, say 77%, and the other has a 1% change. For the large change, assume the probability that it is the correct individual’s device is only 33%, but the other characteristic with a 1% change would have 99.995% as the probability that it is the individual’s device. When we combine the two probabilities, the combined probability that it is the correct individual’s device is 99.9965% even though one characteristic changed by a significant amount. Thus by using two or more characteristics, we can significantly reduce the percentage of false negatives that one characteristic alone would produce.
We should also address the possibility that no trait signatures are available on a device. Regardless of the availability of trait signatures, our process assigns each device a unique device identifier. In the case where no trait signatures are available, it is possible to use that single identifier in a secure manner to authenticate the device. Unfortunately, it may be easier to compromise one unique identifier than a trait signature. In either case, a device that does not have trait characteristics can be used to differentiate from devices with trait characteristics.